No Runny Eggs

The repository of one hard-boiled egg from the south suburbs of Milwaukee, Wisconsin (and the occassional guest-blogger). The ramblings within may or may not offend, shock and awe you, but they are what I (or my guest-bloggers) think.

Archive for the 'Social Security crater' Category

September 24, 2009

The Social Security crater continues

I was originally going to append this to my post from the other day, but there are too many new items to cover.

First, Tom Blumer over at both NewsBusters and BizzyBlog has some disturbing news on the immediate taxation front. He looked up the payroll/self-employment tax numbers for the current quarter (2009 Q3/FY2009 Q4), compared them to the same quarter last year, and found that they were off 2.0% for July and 2.9% for August. Specifically for Social Security, the payroll/self-employment receipt numbers were off 1.7% for July and 2.4% for August.

Worse, the September numbers look like they’ll be another massive disappointment, with withheld income/payroll/self-employment tax receipts off over 17% through the third Monday of the month (9/21/2009 and 9/22/2008) and self-employment tax receipts off over 40% though the same period, or a net drop of almost 25%. Since not all income is taxed, the percent that the Social Security receipts would drop are necessarily a bit less. I’ll return to that momentarily.

Related to that, Tom noted that I could still be too optimistic in giving Social Security three years of 4.59% growth. I decided to re-run the numbers, capping the growthn at 4.02% (what the CBO calls for in FY2015), which reduces the rates in 2012, 2013 and 2014. That yields a minimum yearly primary deficit of $6 billion in FY2012, with FY2013 having a $10 billion primary deficit and FY2019 having a $101 billion deficit. I specifically avoided attempting to model what not having the “interest” that would be required to keep Social Security whole to plow back into the special bonds and certificates would do to the overall “trust fund” picture, but it is safe to say that complete exhaustion would be quite a bit earlier than 2037.

Second, the August 2009 “trust fund” numbers are finally in from Social Security, and the primary deficit is $5.833 billion, the worst since at least 1987. That puts the rolling 12-month primary surplus at $26.859 billion.

Since the September 2008 primary surplus of $3.126 billion drops off the rolling 12-month total, if there is a net zero primary surplus/deficit for September, that would put the FY2009 primary surplus at $23.733 billion. If there were a primary deficit between $5.234 and $6.233 billion, the CBO estimate of a FY2009 primary surplus of $18 billion (rounded to the nearest billion) would be correct. It would merely take a drop in Social Security payroll/self-employment taxes of about 7.4% to get there.

September 22, 2009

Hot Air exclusive – CBO says Social Security to run in the red 2010 and 2011

Ed Morrissey obtained the summer 2009 Congressional Budget Office report on the health of the Social Security “Trust Fund”, and the news isn’t good. The same CBO that, last year under now-Obama budget director Peter Orszag, claimed that the combined OASDI trust fund would not begin to run a primary deficit (what Ed calls a cash deficit and what I’ve called an ex-interest deficit) until 2019, is now saying, at least to Congressmen, that it will run a primary deficit in 2010 and 2011, briefly run a cash surplus between 2012 and 2015, and return to what is presumably a permanent primary deficit in 2016.

I guess that is what the ranking member on the House Committee on Financial Services, Rep. Spencer Bachus (R-AL) was refering to when he told his hometown paper that Social Security would go into the red before 2012 if things didn’t improve dramatically. The 2010 primary deficit is also something predicted in the 80%-confidence curve of the stochastic model.

I do have a problem with the CBO’s numbers starting with 2012, when they claim that the OASDI primary surplus would begin its last run in the black. They assumed a 6.19% growth in revenues derived from the payroll tax in 2012, and a 5.69% growth in revenues in 2013. I decided to re-run the numbers using the still-high 4.59% growth in revenues called for in 2014 for those two years, and low-and-behold, the primary deficit never quite turns around:

On a related note, the Office of the Chief Actuary does not have the August 2009 “trust fund” performance available yet. However, the 12-month primary surplus between August 2008 (when the “trust fund” began running monthly primary deficits) and July 2009 is only $32.5 billion, with 8 of the 12 months having a primary deficit.

Revisions/extensions (10:27 am 9/22/2009) – Corrected a typo due to a misread of the chart. The CBO predicts permanent red ink for Social Security beginning in 2016, not 2017.

R&E part 2 (10:49 am 9/22/2009) – A couple of housekeeping items:

First, thanks for the link, Ed. Without you getting the numbers out of the CBO, I wouldn’t have been able to run with them.

Second the cumulative 10-year primary deficits of $152 billion (if CBO’s numbers are right)-$264 billion (if my numbers are right) will need to be added to the overall 10-year deficit of $9 billion and overall projected debt of $22 billion as they are currently unfunded liabilities.

R&E part 3 (6:02 pm 9/22/2009) – In case you missed the trackbacks on Hot Air, some more good reading can be found at both Ace of Spades HQ and Daily Pundit. Bill Quick notes that the bipartisan Party-In-Government will not let SocSecurity fail spectacularily, though I note that the numbers simply aren’t there for a 1983-style fix, and that final failure isn’t slated for another 25 or so years. The Morons are, as always, our informative and entertaining selves.

R&E part 4 (10:45 am 9/24/2009) – The conversation continues above, with some new numbers from both Tom Blumer and the Social Security Administration.

August 19, 2009

Social Security – worse than expected

(H/T – Amanda Carpenter)

Rep. Spencer Bachus (R-AL), the ranking memeber on the House Committee on Financial Services, did an interview with The Tuscaloosa News editorial board, and unleashed a shocker – Social Security could start running deficits before 2012, far earlier than the most-recent “Intermediate Case” estimate from the Social Security/Medicare Fund trustees of 2016 for the combined OASDI Social Security funds. Quoting Bachus:

The situation is much worse than people realize, especially because of the problems brought on by the recession, near depression….

What this recession has done to Social Security is pretty alarming. We’ve known for 15 years that we were going to have to make adjustments to Social Security, but we still thought that was seven or eight years down the road. But if things don’t improve very quickly, we’re going to be dealing with that problem before we know it.

Back in May, when the trustees issued their report, Ed Morrissey and I picked up on a disturbing trend – there were several months of the OASDI fund running a negative monthly balance, with a very slim 12-month (April 2008-March 2009) positive yearly balance. At the time, I said, “I might not bet on Social Security running red for a 12-month period this year, but I’ll take the ‘early’ in just about any pool.” Looks like the “early” will be paying out.

Revisions/extensions (9:06 pm 8/19/2009) – I just took a quick look at the April and May numbers (I’m wondering why June’s is not available; this time in May, March’s numbers were), and they’re not all that encouraging:

– April had a net positive inflow (less “net interest”, which really is a future tax increase) of just under $20.5 billion. That compares very unfavorably to April 2008, which had a net positive inflow of about $24.3 billion.

– May had a net negative inflow of $1.9 billion, compared to a net positive inflow of $3.1 billion in May 2008.

Taking out the bogus positive of December 2008, that’s 6 out of the last 10 months that had a net negative inflow.

Since I previously warned that looking month-to-month is not a particularily good indicator, let’s put that in terms of year-over-year. That puts the 12-month rolling net inflow, as of May 2009, at just $43.3 billion, $8.9 billion less than the same number just 2 months prior.

One more thing – going back to my May post, I discussed the stoichastic model first sleuthed out by Chuck Blahous. Using a 5,000-run model, the trustees found that half of the time, Social Security went into the red before the end of 2014.

Meanwhile, the 2011 time frame Bachus talked about to The Tuscaloosa News is within the 80%-confidence window of that model. Indeed, that window starts in 2010, and runs until 2017.

R&E part 2 (12:51 pm 8/20/2009) – Welcome to the craziest part of the extended Hot Air universe. If you didn’t read Ed’s current column at American Issues Project, I recommend you do so sometime today.

In the meantime, I encourage you to take a look around and enjoy the hospitality Shoebox and I (but mostly Shoebox) have to offer.

R&E part 3 (9:18 am 8/21/2009) – Welcome Doug Ross @ Journal readers. Again, I encourage you to take a look around and enjoy the hospitality Shoebox and I have to offer.

May 13, 2009

Federal financial meltdown – dead ahead

The Social Security trustees released their annual statement of the states of the Social Security and Medicare trust funds yesterday, and things are very ugly. From the “Intermediate Case”:

– The Disability Insurance (DI) portion of Social Security, which has cost more to run than its dedicated tax revenue source provides (i.e. it’s running in the red) since 2005, will have its “trust fund” exhausted in 2020.
– The Old-Age and Survivors Insurance (OASI) portion of Social Security will begin to run in the red in 2017.
– The combined Old-Age and Survivors and Disability Insurance (OASDI) “trust fund” will begin to run in the red in 2016, with “fund” exhaustion in 2037.
– The Hospital Insurance (HI) portion of Medicare, which began to run in the red last year, will exhaust its “trust fund” in 2017.
– The Supplementary Medical Insurance (SMI) portion of Medicare, which funds both outpatient care (Part B) and the prescription drug benefit (Part D), only avoids “trust fund” exhaustion because automatic increases from both the enrollees and the general fund. Even here, there is a big warning – because most of the enrollees are protected from the bulk (and for at least this year, any) increase in Part B fees under a “hold-harmless” provision, those not covered by the provision (high-income, new enrollees, and the states through Medicaid) will be facing an extraordinary increase in fees.

Rep. Paul Ryan (R-WI – and my Congressman) notes that the 75-year unfunded liability in the programs increased from $40 trillion last year to $43 trillion this year. That $3 trillion increase is rather close to the proposed 2010 budget. He also notes that, despite these serious problems, the Obama administration wants to expand entitlement spending like the programs listed above by $1.4 trillion over the next 10 years.

Ed Morrissey connects the dots and finds, that among other things, credit default insurance on US Treasury debt briefly cost more than credit default insurance on McDonald’s debt. Also, there was a nearly-failed 30-year T-bond auction last week, rescued only after the Treasury raised the interest rate it will pay on the bonds.

But wait, it gets worse. Chuck Blahous read the stochastic projections stuck in one of the appendices of the OASDI report. Before I continue with the bad news, allow me to briefly explain what the stochastic projection is, and how it’s different from the “deterministic” model that the Intermediate Case and the other two main cases the majority of the report uses. The “deterministic” model uses a carefully-selected assumption of various variables, which for the most part, do not change once the variables reach the ultimate conclusion. The stochastic model creates an equation that allows the variables to fluctuate randomly within parameters set by historical records. Specifically in this case, the equations were written so that, without the random fluctuations, the “Intermediate Case” numbers would be the result.

The math geniuses then ran the numbers with the combined OASDI “trust fund” 5,000 times to come up with a spread of projections, and then came up with a probability curve based on the results. The median (50th percentile) projections were that Social Security would first run in the red in 2014 (2 years earlier than the “Intermediate Case”), and the “trust fund” would first be exhausted in 2036 (1 year earlier than the “Intermediate Case”; note that not all the simulations predict a permanent exhaustion of assets the first year of exhaustion).

What is more interesting is what the stochastic model predicts with 80% confidence (between the 10th percentile and the 90th percentile) and with 95% confidence (between the 2.5th percentile and the 97.5th percentile). With 80% confidence, the stochastic model predicts that Social Security would first run in the red sometime between 2010 (that’s next year, folks) and 2017 (a mere year after the “Intermediate Case”), with first-year exhaustion sometime between 2032 and 2043. With 90% confidence, it predicts that Social Security will begin to run in the red sometime between 2009 (that’s this year, folks) and 2019, with first-year exhaustion sometime between 2030 and 2052.

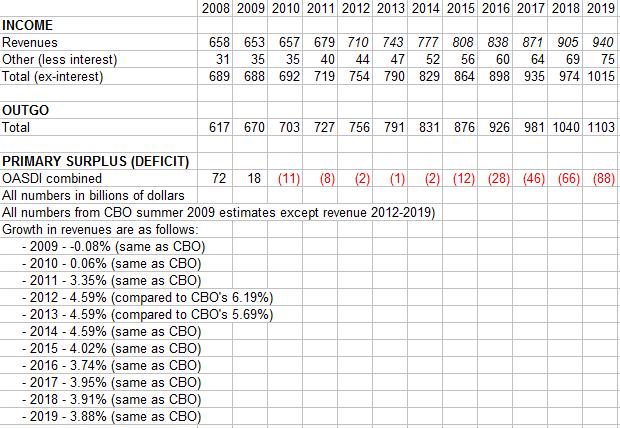
How likely is it that Social Security would go into the red this year? Chuck notes that the 2009 “cash surplus” projection (total revenues minus both total expenses and “net interest”, which really is an unfunded liability and not an asset) is down from $87 billion this time last year to $19 billion (actually, $18.8 billion) this year under the “Intermediate Case” projection. It also is down from a “cash surplus” of $73.7 billion last year.

Meanwhile, Ed noted the beginnings of something interesting regarding the OASDI “trust fund” – it ran a negative balance in February. I ran with that, and found that 4 of the last 8 months (August 2008-March 2009) were officially negative: August 2008, October 2008, November 2008, and February 2009. Toss out the “net interest” that propped up December, and it’s up to 5 of the last 8 months.

Because revenues (as well as the misapplied “net interest”) do not come in nearly as regularily as expenditures go out, it is a bit of a reach to say that Social Security is officially in the red. After taking out the “net interest”, the last 8 months saw a “cash surplus” of $14.7 billion, and the last 12 months saw one of $52.2 billion. That is compared to an 8-month “cash surplus” of $38.0 billion between August 2007 and March 2008, and a 12-month “cash surplus” of $76.9 billion (corrected the decimal) between April 2007 and March 2008.

I might not bet on Social Security running red for a 12-month period this year, but I’ll take the “early” in just about any pool.

[No Runny Eggs is proudly powered by WordPress.]