Note – a version of this originally appeared on DaTechGuy Blog as part of DaTechGuy’s Magnificent Seven. Do make sure you head there daily from content from both Pete Da Tech Guy and the rest of the Magnificent Seven.
Two weeks ago, the New York Post‘s John Crudele broke the story that the Census Bureau, which conducts the Current Population Survey (CPS) that is the basis for the unemployment rate reported by the Bureau of Labor Statistics (BLS), has been falsifying the data since 2010. Curdele interviewed a person who was caught by the Census Bureau in 2010 simply making up data, with the employee claiming his superiors told him to do so because his region was not successfully interviewing enough people for the survey. According to an anonymous source, that effort intensified in the months leading up to the 2012 election, with September 2012’s data specifically falsified to President Barack Obama’s favor, and continues to the present time.
These allegations are currently being investigated by both the House Oversight Committee and the Inspector General of the Census Bureau, with the BLS also quite interested in them.
One place they can start is comparing what came out of the CPS to a measure of unemployment conducted by Gallup, started in January 2010. There are a couple of key differences between the CPS and Gallup which make a comparison a bit harder:
– While the CPS uses a reference week that includes the 12th of the month (5th of the month in November), Gallup uses a 30-day rolling average.
– The CPS surveys (or claims to survey) 60,000 people age 16 and over, while over the course of each 30-day rolling average, Gallup surveys 30,000 adults.
Fortunately, the BLS releases, as part of its dataset, the data from the portion of the CPS that covers adults, or about 57,500 surveyed out of approximately 153,000,000 considered part of the labor force. That allows an apples-to-apples comparison:
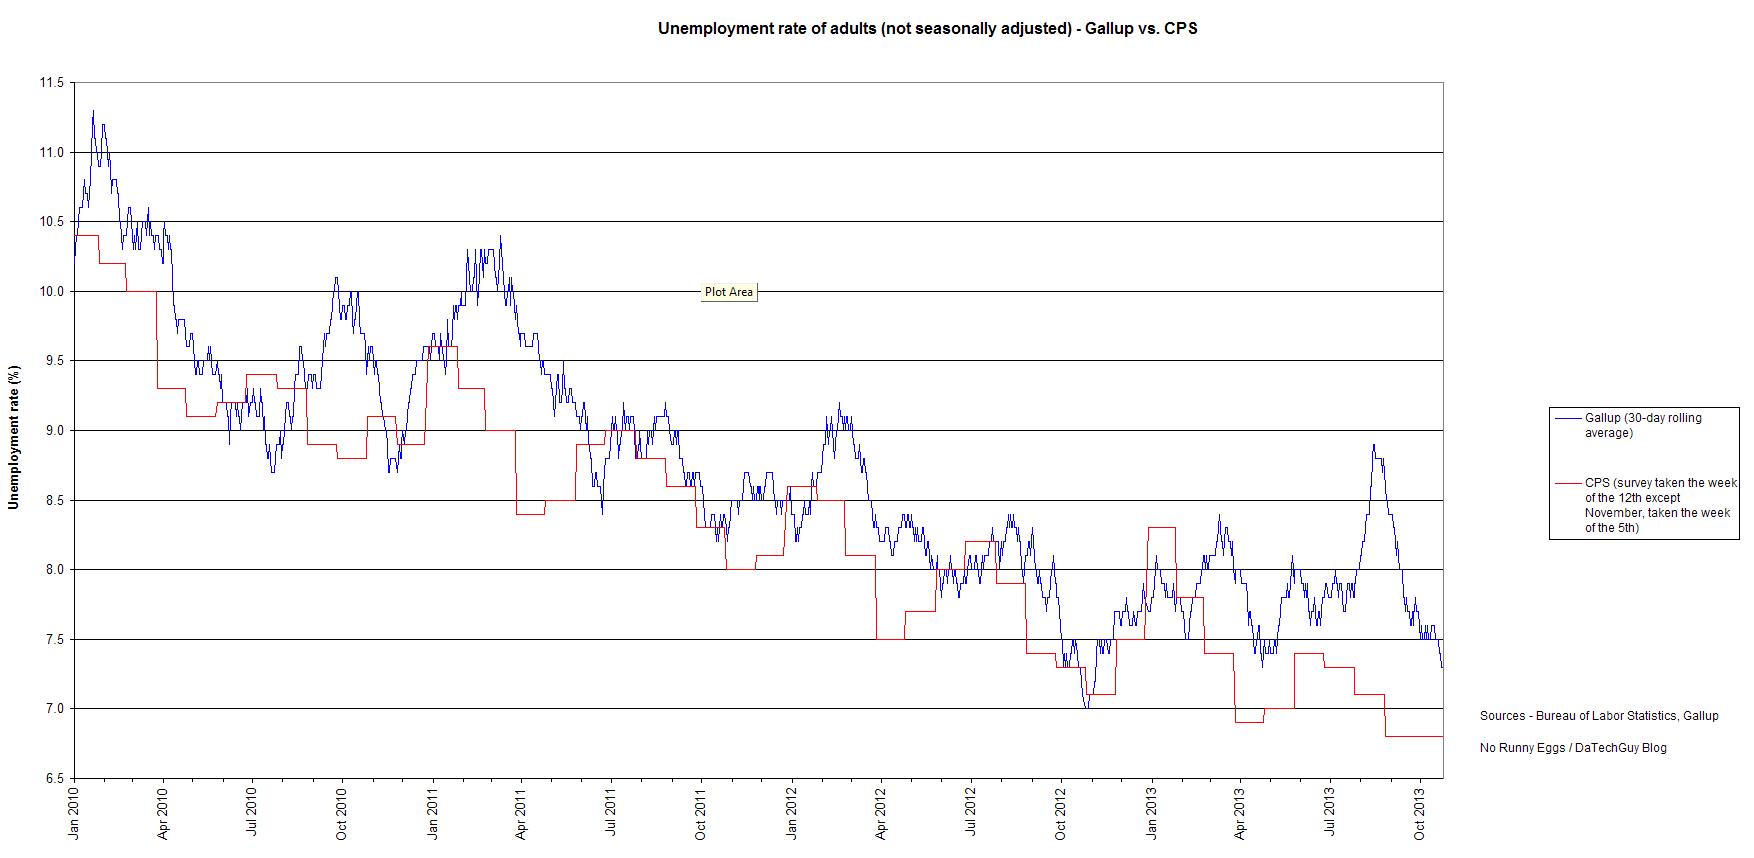
For the most part, the CPS measure of adult unemployment is significantly lower than Gallup’s measure. How significant? Let’s take a look at Gallup’s measure on the day that puts the CPS reference day right in the middle of the rolling average, the 27th day of the month (20th for November and also December to avoid an artificial post-Christmas spike). The CPS unemployment was calculated by dividing the number of unemployed by the number considered to be in the workforce, so I could get much closer than to the nearest tenth of a percentage point reported. The raw data was not available for Gallup’s measure of unemployment, so I took the closest possible number to the CPS measure that still rounded to Gallup’s tenth of a percentage point reported.
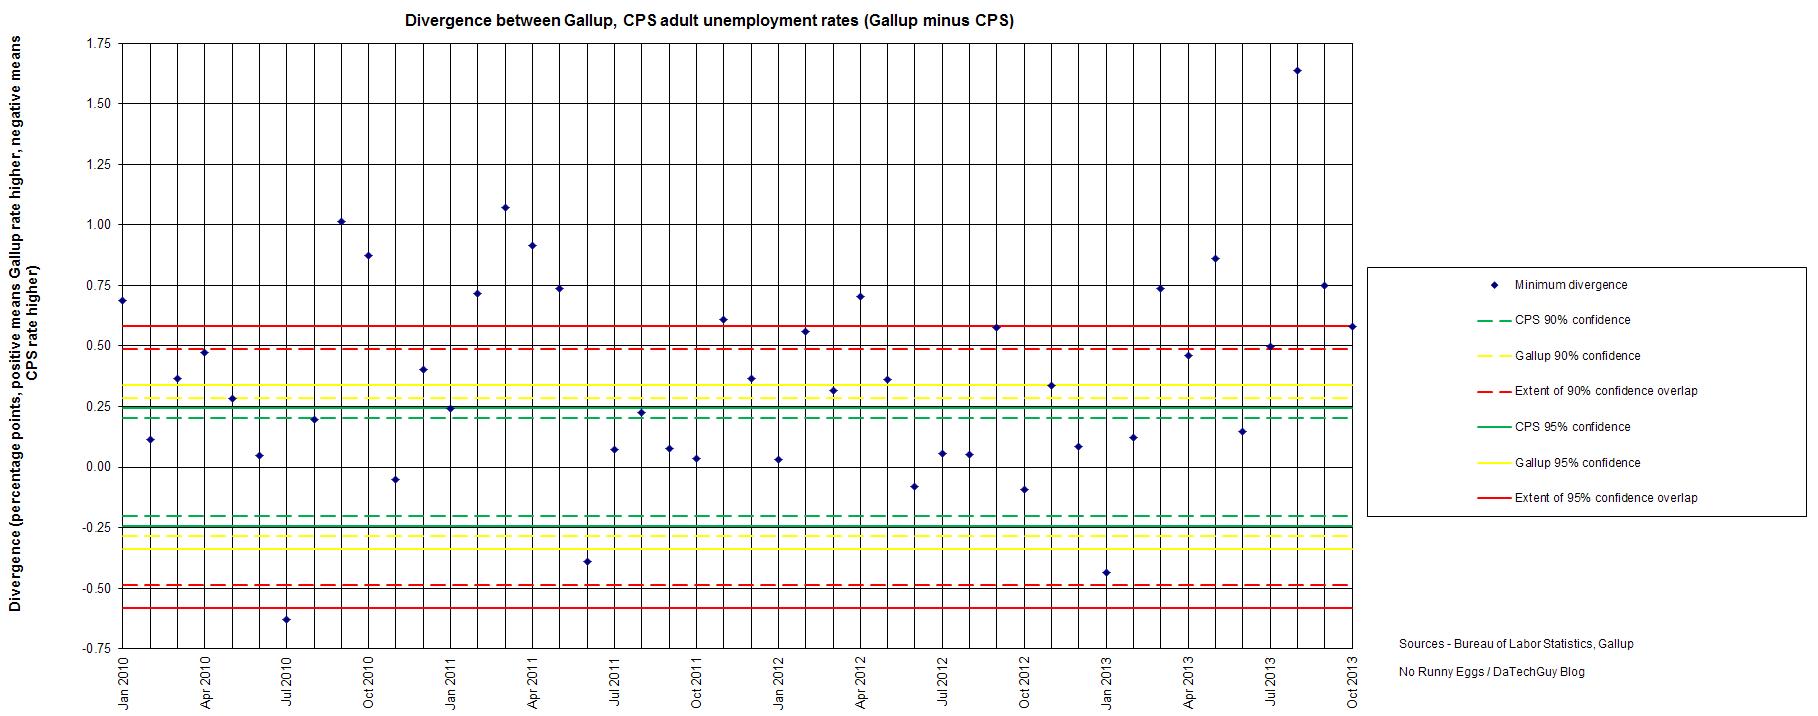
Polls, which is what the CPS and Gallup measures really are, come with a margin of error, within which the true value can be expected either 90% or 95% of the time. For the CPS, the 90%-confidence margin of error is +/-0.20 percentage points and the 95%-confidence margin of error is +/-0.24 percentage points. For Gallup, the 90%-confidence margin of error is +/-0.28 percentage points and the 95%-confidence margin of error is +/-0.34 percentage points.
Two polls are considered to be in good agreement when their values are within each others’ margin of error. Meanwhile at least one poll has to be wildly incorrect when the difference between the two is more than the sums of their margin of error. Out of 46 months’ worth of data:
– 18 months saw Gallup’s and CPS’s measures of unemployment disagree by more than the combined 90%-confidence margin of error of 0.49 percentage points, with 17 months having Gallup’s measure higher.
– 8 months saw the measures of unemployment disagree by between 0.28 percentage points (Gallup’s 90%-confidence margin of error) and 0.49 percentage points, with another 3 months seeing a disagreement between 0.20 percentage points (CPS’s 90% confidence margin of error) and 0.28 percentage points.
– 17 months saw the measures of unemployment in “good agreement”, disagreeing by less than 0.20 percentage points.
When two polls wildly disagree more than they are in “good agreement”, one of them has to be wrong. Given the disagreement has been almost invariably in the administration’s favor, and there already was a proven round of fakery in the CPS, it sure looks like the official measure of unemployment has been cooked longer than a burnt turkey.
