I’m sure you have heard by now that the official unemployment rate has “dropped” to a seasonally-adjusted 8.3% last month, with the somewhat-broader U-4 (which includes “discouraged workers”) and U-5 (which includes “those marginally-attached to the labor force) declining to 8.9% and 9.9% respectively. That’s pretty much where the good news ends, unfortunately.
On a seasonal basis, the 141,637,000 employed is lower than it was in February 2009, and indeed the last time prior to that point it was that low was May 2005. On the other side of the equation, the 12,758,000 officially unemployed (i.e., they didn’t have a job and looked for one in the 4 weeks prior to the mid-January survey) is higher than any point prior to February 2009. Worse, the 6,319,000 who want a job but were not counted as “unemployed” because they had not looked for work in the previous 4 weeks was higher than any point between May 1994 (the fifth month this stat was recorded) and December 2010, and over 1 million higher than any time between one month prior to Bill Clinton’s re-election (October 1996) and Barack Obama’s election in November 2008. Zero Hedge noticed a record 1.2 million departing the labor force on a seasonal basis (or if you prefer unseasoned numbers, Ed Morrissey noted it as nearly 1.6 million on an unadjusted basis).
Others have used different modifiers. ShadowStats uses a proprietary method to add in what it sees as “long-term discouraged workers” to the U-6 rate, while AEI’s James Pethokoukis uses the labor-participation rate as it was in prior years.
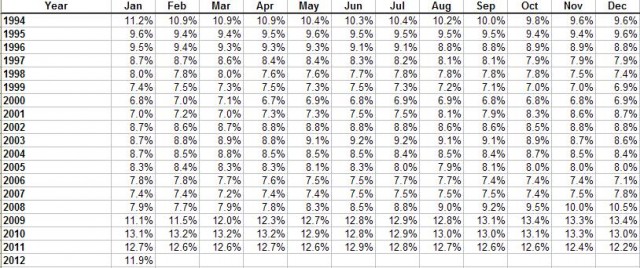
The absolute simplest definition of the unemployment rate is to divide the number of people who want a job but don’t have one by the sum of that number and the number of people who have a job. Unfortunately, since that number is often embarrassing to those in public office, it is never publicized, and indeed, has only been able to be accurately calculated since 1994. Think of the chart below as “U-5Plus”, as it takes everybody who is unemployed and wants a job and divides it by that number plus those who want a job.

Click for the full-size image.
The 11.9% of the potential labor force who want a job but do not have one is higher than any month prior to March 2009. Worse, the Congressional Budget Office doesn’t see the future as too bright. They don’t see the number of employed returning to the first-quarter 2008 high of 146 million until the first quarter of 2015.
[…] Is a stagnation rate 8.3%, 8.9%, 9.9% or 11.9%? […]