No Runny Eggs

The repository of one hard-boiled egg from the south suburbs of Milwaukee, Wisconsin (and the occassional guest-blogger). The ramblings within may or may not offend, shock and awe you, but they are what I (or my guest-bloggers) think.

Archive for the 'Economy' Category

December 3, 2013

Cooking the unemployment numbers

by @ 20:24. Filed under Economy, Politics - National.

Note – a version of this originally appeared on DaTechGuy Blog as part of DaTechGuy’s Magnificent Seven. Do make sure you head there daily from content from both Pete Da Tech Guy and the rest of the Magnificent Seven.

Two weeks ago, the New York Post‘s John Crudele broke the story that the Census Bureau, which conducts the Current Population Survey (CPS) that is the basis for the unemployment rate reported by the Bureau of Labor Statistics (BLS), has been falsifying the data since 2010. Curdele interviewed a person who was caught by the Census Bureau in 2010 simply making up data, with the employee claiming his superiors told him to do so because his region was not successfully interviewing enough people for the survey. According to an anonymous source, that effort intensified in the months leading up to the 2012 election, with September 2012’s data specifically falsified to President Barack Obama’s favor, and continues to the present time.

These allegations are currently being investigated by both the House Oversight Committee and the Inspector General of the Census Bureau, with the BLS also quite interested in them.

One place they can start is comparing what came out of the CPS to a measure of unemployment conducted by Gallup, started in January 2010. There are a couple of key differences between the CPS and Gallup which make a comparison a bit harder:

– While the CPS uses a reference week that includes the 12th of the month (5th of the month in November), Gallup uses a 30-day rolling average.
– The CPS surveys (or claims to survey) 60,000 people age 16 and over, while over the course of each 30-day rolling average, Gallup surveys 30,000 adults.

Fortunately, the BLS releases, as part of its dataset, the data from the portion of the CPS that covers adults, or about 57,500 surveyed out of approximately 153,000,000 considered part of the labor force. That allows an apples-to-apples comparison:

Gallup-CPS

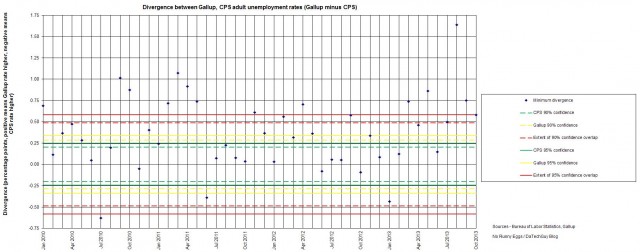
For the most part, the CPS measure of adult unemployment is significantly lower than Gallup’s measure. How significant? Let’s take a look at Gallup’s measure on the day that puts the CPS reference day right in the middle of the rolling average, the 27th day of the month (20th for November and also December to avoid an artificial post-Christmas spike). The CPS unemployment was calculated by dividing the number of unemployed by the number considered to be in the workforce, so I could get much closer than to the nearest tenth of a percentage point reported. The raw data was not available for Gallup’s measure of unemployment, so I took the closest possible number to the CPS measure that still rounded to Gallup’s tenth of a percentage point reported.

Gallup-CPS divergence

Polls, which is what the CPS and Gallup measures really are, come with a margin of error, within which the true value can be expected either 90% or 95% of the time. For the CPS, the 90%-confidence margin of error is +/-0.20 percentage points and the 95%-confidence margin of error is +/-0.24 percentage points. For Gallup, the 90%-confidence margin of error is +/-0.28 percentage points and the 95%-confidence margin of error is +/-0.34 percentage points.

Two polls are considered to be in good agreement when their values are within each others’ margin of error. Meanwhile at least one poll has to be wildly incorrect when the difference between the two is more than the sums of their margin of error. Out of 46 months’ worth of data:

– 18 months saw Gallup’s and CPS’s measures of unemployment disagree by more than the combined 90%-confidence margin of error of 0.49 percentage points, with 17 months having Gallup’s measure higher.
– 8 months saw the measures of unemployment disagree by between 0.28 percentage points (Gallup’s 90%-confidence margin of error) and 0.49 percentage points, with another 3 months seeing a disagreement between 0.20 percentage points (CPS’s 90% confidence margin of error) and 0.28 percentage points.
– 17 months saw the measures of unemployment in “good agreement”, disagreeing by less than 0.20 percentage points.

When two polls wildly disagree more than they are in “good agreement”, one of them has to be wrong. Given the disagreement has been almost invariably in the administration’s favor, and there already was a proven round of fakery in the CPS, it sure looks like the official measure of unemployment has been cooked longer than a burnt turkey.

November 8, 2013

$2.999

by @ 6:12. Filed under Economy, Energy.

That is the price for regular unleaded at one of the local gas stations. With Obama’s EPA still searching for any way to do to privately-owned land and state-owned land where fracking has been occuring what they have done to federal-owned/controlled land, namely stop fracking and new oil exploration, I never thought I would once again see the day I could walk into a gas station with a $20 bill and a $10 bill, pay for 10.000 gallons of gas, and get change back.

Of course, it is the winter blend of Algore/Whitman Memorial Reformulated Gas With 10% Corn-A-Hole, so it’s 10% less efficient than the summer version of that (and even less efficient than untainted gas). It’s also still too damn high.

October 8, 2013

Jimmy Carter – today’s middle class is as poor as the poor were in my day

by @ 8:06. Filed under Economy, Politics - National.

Really, Peanut Farmer? Let’s ignore the middle class for now and compare the poor now and the poor then:

  • Back then, the average family had one color TV out in the living room and maybe one black-and-white TV in the parents’ bedroom. Now, there’s color TVs in every room used for either living or entertaining (oh yeah, they’re probably hooked into a pay-TV service and some are hooked into gaming consoles, neither of which were exactly the province of the poor or the middle class back in Peanut Farmer’s day).
  • Back then, there were 2, maybe 3, phones in the house on a single line. Now, every family member over the age of 12 has his or her own phone and phone number (and they’re portable, and a couple are probably smartphones, again not exactly the province of either the poor or the middle class, or in the case of the smartphone, even the ultra-rich, back in the Peanut Farmer’s day).
  • Back then, home-cooked meals, and cooked-from-scratch meals, were the norm, with even fast-food restaurant a rare treat. Now, dinner is about as likely to come out of a McDonald’s bag or a Domino’s box as it is out of a heat-and-serve one, and a cooked-from-scratch meal is the rare treat.
  • Back then, there might have been 2 cars in the household, and most likely only if the mom also worked. Now, it’s as likely as not that little Biffy/Buffy has his/her own car to drive to prom (which would make 3 cars in the average 2-parent family because, thanks to a historically-high overall government demand, mom has to work too).

I will grant that there has been a major slip backward since the summer of 2008 with the “legacy” rich’s attempt to make sure Al Czervik doesn’t even have enough money to think about getting into Bushwood, but that’s on the Peanut Farmer’s party.

September 5, 2012

Hope, change, continued decline in economic competitiveness

by @ 7:18. Filed under Economy Held Hostage.

CNBC reports that in the latest edition of the World Economic Forum’s Global Competitiveness Report, the United States fell another two positions to the 7th-most-competitive economy, driven by the unresolved governmental fiscal crises and lack of trust in politicians to either fix said problems or stay away from repeating Government Motors throughout the entire economy. Worse, two Eurozone countries, the Netherlands and Germany, despite having to deal with the basket cases known as the PI(I)GS (Portugal, Italy, Spain, and sometimes Ireland), climbed ahead of us.

Did I mention that, before President Downgrade came into office, the US was ranked #1? We need to end the hostage situation.

June 27, 2012

I wouldn’t want to be Bo tomorrow!

If you blog about politics, it’s hard not to toss a blog up prior to tomorrow’s announcement re: Placebocare.

I’m on vacation in the great northern parts of Minnesota so this won’t be long. I want it down to play against after the decision is revealed and for posterity…it’s too damn easy to say “yeah, I knew that’s what would happen!”

Placebocare is going down in flames. I say this not because I want it to…I do, but because of the signs along the way.

Ginsberg inkled the decision a few weeks back when she said that the decisions would have “sharp disagreement.” I can’t see her making this comment without the single most important case of the session, and arguably of this generation, in mind.

Second, it appears that Chief Justice Roberts himself will be writing the opinion for the case. There is much rumor on this but it makes sense as he is the only justice who has not written one this go around. I think the fact that Roberts writes the opinion makes the mandate a goner.

As to the rest of Placebocare, I think once the mandate is gone, the Supreme Court will also decide that the rest of the bill needs to go. I think there will be two likely arguments for this.

First, the Commerce Clause has been used as an excuse for Congress to pass legislation on damn near anything they wanted to for the past 40 years or so. “The slippery slope” is no longer a theory, it is real. I think that given that the administration argued for the right to do this under the Commerce Clause, the Supremes will take this chance to council Congress on what is and what is not acceptable to slide under the Commerce Clause door. I would expect Roberts to see this decision as his legacy in the court. I don’t seem him passing up this opportunity to put his stamp on the history of the court.

Second, the Administration gave the Supremes the perfect out on shooting the entire bill as they argued that the mandate was essential to make Placebocare work financially. I can’t remember who, it may have been Roberts, made the astute observation that it was somewhat indefensible of the Administration to ask the Supremes to figure out the financial implications of what should stay or go in the Placebocare law if the mandate was struck. Hell, Nancy Pelosi didn’t even know what was in the bill until it was signed but knew it was a good law. How could the Supremes be more omniscient than Nancy P and Harry R?

OK, so Placebocare is dead, then what?

Well, if you thought Obama was petulant after he got slapped on Arizona, you ain’t seen nothing yet!

If this goes as I see it, Obama is a lame duck. Worse, he’s a dead duck politically. Unfortunately, he will still hold the office of President for several more months. I don’t expect Obama to go quietly into that good night. Rather, like post Arizona, I think we could see petulance at a level not seen since the last of the Roman emperors. We are likely to see all kinds of Executive orders made dealing with administration and fund dispersal of various federally supported medical programs. Obama’s sole intent will be to leave office with a great big “I told you so” sign on his bumper. He will attempt to cause chaos in as many medical programs as possible just to be able to say that his plan would have prevented all of that. In fact, I wouldn’t be a bit surprised to see him do this and couch it as things he must now do to be fiscally responsible

Obama has shown himself to be a very sore loser. I wouldn’t want to be Bo his dog, tomorrow night!

May 14, 2012

DOR chief economist explains the difference between CES, CPS/LAUS employment

by @ 16:22. Filed under Economy, Politics - Wisconsin.

Some people, like Tim Nerenz, noticed a rather disturbing disparity between the two main measures of employment earlier this month. One measure, the Local Area Unemployment Statistics, based on the Current Population Survey, said that 21,570 (rounded up to 21,600) more Wisconsinites were working in March 2012 than in March 2011. The other measure, the Current Establishment Survey, said that there were 30,000 fewer jobs in March 2012 than in March 2011.

Department of Revenue chief economist John Koskinen addressed that disparity last Thursday at a meeting of the Association of Government Accountants….

To wit, Koskinen noted that the CES slide in employment was not supported by the all-establishment Quarterly Census of Employment and Wages (for the first quarter of disparity, the third quarter of 2011), tax revenues received by Wisconsin, per-capita income growth in 2011, or initial unemployment claims. For those of you interested in the PowerPoint portion of the presentation, Christian Schneider posted the slides that are included, in somewhat-pixelated form, on the video.

Before I continue, however, I do have to quote for the benefit of the lefties who might think Koskinen is a Walker stooge his short biography included in the DOR press release:

Prior to joining the Wisconsin Department of Revenue agency in 2007 as Chief Economist, John Koskinen served as a Staff Economist for the Wisconsin Department of Administration from 1979 to 2007. He started his professional career at the Wisconsin Legislative Fiscal Bureau. Koskinen has his B.A. and M.A. in Economics from Marquette University, as well as additional graduate studies in Economics at Northwestern University.

That’s right – Koskinen became DOR’s chief economist in the middle of Democrat Jim Doyle’s administration.

QCEW begins to break the tie

A quick explanation of what is covered by the three measures of employment is in order. The CPS/LAUS survey, covering 60,000 people on a national level and roughly 4% of Wisconsinites of working age, is the smallest of the three, though it covers every conceivable form of legal employment. The CES, covering 440,000 worksites on a national level and approximately 10% of Wisconsinites of working age, misses those who are self-employed and thus not covered by a form of unemployment insurance. The QCEW, covering every one of the approximately 9.7 million employers who pays unemployment taxes (thus missing the self-employed, railroad employees and religious institution employees), is a trailing indicator as it is released 6 months after the quarter that it covers.

For the first 6 months of 2011, the year-over-year changes in all three measures were on essentially the same slope. Starting in July, the year-over-year change in the CES started to separate from the year-over-year changes in the CPS/LAUS and QCEW. As Koskinen somehow used seasonally-adjusted data for the CPS/LAUS data while using unadjusted CES data and actual QCEW data, I redrew the chart to use the same measure for all three sets of data:


Click for the full-sized chart

The CES really diverged from both the climbing CPS/LAUS and QCEW in August. Against the QCEW, the disparity grew from an average of the QCEW year-over-year change being 5,000 higher than that of the CES for the first half of the year (and 5,700 higher in June) to the QCEW year-over-year change being 32,500 higher in September, the last month QCEW data is available. Against the CPS/LAUS, the disparity went from an average of the CES year-over-year change being 16,600 higher than that of the CPS/LAUS (and 21,200 in June) to the CPS/LAUS year-over-year change being larger than the CES year-over-year change starting in September, growing to a 49,400 disparity in December, and reaching a 51,570 disparity in March.

Koskinen blamed the fact that the second quarter was used as the yearly “benchmark” of the CES rather than the third quarter. I cannot properly evaluate that claim, but the DOR produced a chart supporting this allegation:


Click for the full-sized chart

Wages and tax collections support the CPS/LAUS numbers

The Bureau of Economic Analysis said that per-capita personal income in Wisconsin grew by 4.8% in between 2010 and 2011. That is not only significantly higher than the national average of 4.3% growth, but was the 11th-highest in the country.

In part because of that, and in part because the Republicans repealed the “millionaires’ tax” and combined reporting instituted by the Democrats when they had total control of state government in 2009, general-purpose revenue increased by an adjusted 4.3% for the first 10 months of FY2012 from FY2011 (that adjustment is downward from 6.0% due to more pay periods this time around). That includes an adjusted 4.5% increase (7.8% unadjusted) in individual income taxes, a 4.8% increase in sales taxes, and 5.4% in corporate taxes. Of note, FY2012 started in July 2011, when the CES measure of employment began to wildly diverge from the other two measures.

Initial unemployment claims for 2011 well below that of 2010, with the last 7 months at pre-recession levels

Perhaps the data that is most damning of the CES “job loss” is initial unemployment claims. The DOR produced a chart showing that those claims are the lowest in 5 years. Once again, I created my own chart, partly to remove the “clutter” of 2009 and 2010 from the DOR chart, partly to align the weeks to the week being reported instead of the week the report was issued, and partly to further demonstrate the point by choosing 2006 instead of 2007 (after all, the Great Recession supposedly started in December 2007).


Click for the full-sized chart

Throughout 2011, initial unemployment claims were below 2010 levels. Indeed, by the 40th week, it was virtually indistinguishable from 2006 levels, and that trend continued through this year.

That is a measure more of a 1-month change than a 12-month change. So, how do the years compare? Allow me to give you one more chart, this time directly from the BLS:

Something just doesn’t add up, and it’s rather clear it’s the CES numbers everybody has been taking as the last word on jobs.

February 12, 2012

Peek-A-Boo America!

As the battle between President Obama and the Catholic Church continued, President Obama attempted to diffuse the growing angst with something he classified as a “compromise.” The compromise from the White House’s fact sheet:

Under the new policy to be announced today, women will have free preventive care that includes contraceptive services no matter where she works. The policy also ensures that if a woman works for a religious employer with objections to providing contraceptive services as part of its health plan, the religious employer will not be required to provide, pay for or refer for contraception coverage, but her insurance company will be required to directly offer her contraceptive care free of charge.

Wow, that’s great! Religious organizations no longer have to pay for insurance that provides for contraceptive coverage! How magnanimous on the part of the President! In fact, the President who would be King, has fixed the problem by decreeing that all insurance companies must provide said contraceptive coverage in the plans offered to these religious institutions for FREE!

o Insurance companies will be required to provide contraception coverage to these women free of charge.

If I’m reading this right, Obama believes that the issue the Catholic Church had, was paying for the cost of contraception. I’m not Catholic but I do understand a fair amount of their doctrine. I’m pretty sure that the Church didn’t have a proviso that allowed for contraception if you could get someone else to pay for it! In fact, the US Conference of Catholic Bishops have already called out Obama for his ruse that he claims is a “compromise:”

And in the case where the employee and insurer agree to add the objectionable coverage, that coverage is still provided as a part of the objecting employer’s plan, financed in the same way as the rest of the coverage offered by the objecting employer. This, too, raises serious moral concerns.

Beyond the theological issue, I’m having a tough time figuring out how exactly, Obama believes that forcing the insurance companies to provide something “for free” does not result in having the insurer pay for it? Does Obama really believe that by simply saying “it is free” that it actually is free? I’ve been a Southerner for nearly two years now. However, unless they’ve rewritten the rules of economics in that time, the only thing Obama’s mandate has done is shift costs and increase the costs for all of our insurance to pay for the contraceptive services for those who get it for “free”. In fact, some accounts have the costs for this “free contraception” as high as $2.8B, a portion of which will now be shared by all 60+ year old women and all males. Speaking of which, if we’re all so concerned about making sure contraception is free, where are my coupons for condoms?

Peek-A-Boo is a game played with young children. We’ve all likely played it at some time. In Peek-A-Boo we play on the young child’s lack of understanding about reality. We attempt to convince them that when we cover our eyes, we somehow disappear even though the child can still see us. it’s a game that loses it’s cuteness as the child grows to understand that reality is reality and that words or claims that reality isn’t so, doesn’t change reality.

Obama’s contraception “compromise” is in the end, nothing more than a game of Peek-A-Boo with the American public. Obama makes claims about insurance economics that simply are not born out by reality. Of course, you would have to have matured beyond the economic age of two to actually realize such a thing. An economic age that most on the left never approach, let alone grow beyond.

Peek-A-Boo seems so innocuous with toddlers, and it is. However, as adults, Peek-A-Boo is escapism and an inability to deal with the world in real terms. Unfortunately, it is this very game of Peek-A-Boo that most in DC would use to tell us that: Massive Deficits aren’t a problem, Every increasing debt isn’t a problem, growing numbers of people on the government dole is not a problem, fewer and fewer actual tax payers aren’t a problem, Iran isn’t a problem, increasing costs of energy aren’t a problem and 8+% unemployment is the new norm. To those people who want to continue to play Peek-A-Boo rather than solve problems I say:

“I see you!”

February 3, 2012

Is the unemployment rate 8.3%, 8.9%, 9.9% or 11.9%?

by @ 11:24. Filed under Economy Held Hostage.

I’m sure you have heard by now that the official unemployment rate has “dropped” to a seasonally-adjusted 8.3% last month, with the somewhat-broader U-4 (which includes “discouraged workers”) and U-5 (which includes “those marginally-attached to the labor force) declining to 8.9% and 9.9% respectively. That’s pretty much where the good news ends, unfortunately.

On a seasonal basis, the 141,637,000 employed is lower than it was in February 2009, and indeed the last time prior to that point it was that low was May 2005. On the other side of the equation, the 12,758,000 officially unemployed (i.e., they didn’t have a job and looked for one in the 4 weeks prior to the mid-January survey) is higher than any point prior to February 2009. Worse, the 6,319,000 who want a job but were not counted as “unemployed” because they had not looked for work in the previous 4 weeks was higher than any point between May 1994 (the fifth month this stat was recorded) and December 2010, and over 1 million higher than any time between one month prior to Bill Clinton’s re-election (October 1996) and Barack Obama’s election in November 2008. Zero Hedge noticed a record 1.2 million departing the labor force on a seasonal basis (or if you prefer unseasoned numbers, Ed Morrissey noted it as nearly 1.6 million on an unadjusted basis).

Others have used different modifiers. ShadowStats uses a proprietary method to add in what it sees as “long-term discouraged workers” to the U-6 rate, while AEI’s James Pethokoukis uses the labor-participation rate as it was in prior years.

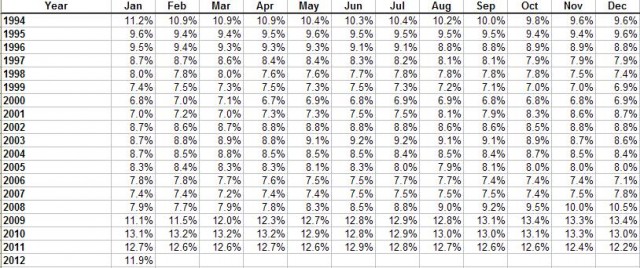
The absolute simplest definition of the unemployment rate is to divide the number of people who want a job but don’t have one by the sum of that number and the number of people who have a job. Unfortunately, since that number is often embarrassing to those in public office, it is never publicized, and indeed, has only been able to be accurately calculated since 1994. Think of the chart below as “U-5Plus”, as it takes everybody who is unemployed and wants a job and divides it by that number plus those who want a job.


Click for the full-size image.

The 11.9% of the potential labor force who want a job but do not have one is higher than any month prior to March 2009. Worse, the Congressional Budget Office doesn’t see the future as too bright. They don’t see the number of employed returning to the first-quarter 2008 high of 146 million until the first quarter of 2015.

January 11, 2012

Bo(eh)ned Again – Debt Edition

Tina Korbe had her innocence robbed when she discovered a CNSNews article on just how much debt has been added since the first continuing resolution was passed by the present Congress on March 4, 2011. Allow me to throw a few numbers out there (actually, more-or-less repeating a comment I left on the Hot Air thread):

  • $1,680,817,192,540.69 – The average 52-week debt increase between 1/19/2010 (actually extending back to 1/20/2009 and Obama’s inauguration) and 3/4/2011 (the first CR from the current Congress).
  • $1,293,934,755,020.23 – The average 52-week debt increase between 3/7/2011 (actually extending back to 3/8/2010 because it hasn’t been 12 months) and yesterday.
  • $1,045,531,781,579.60 – The lowest 52-week debt increase of the Obama administration, between 8/2/2010 and 8/1/2011. Not coincidentally, 8/1/2011 was the last full day of the several-month-long debt-ceiling fight, during which the federal government was pretty much unable to borrow additional money for several months.
  • $1,216,937,631,311.90 – The latest 52-week debt increase, between 1/11/2011 and 1/10/2012 (the last date debt data was availalbe).
  • $769,700,000,000.00 – The record yearly increase in nominal (current-dollar) gross domestic product, in 2005.
  • $830,400,000,000.00 – The record seasonally-adusted-and-annualized increase in quarterly-reported GDP, between the second quarter of 2005 and the second quater of 2006.
  • $570,000,000,000.00-$600,000,000,000.00 – The expected increase in nominal GDP for 2011.

Why, it’s “wonderful” news that, instead of increasing debt at nearly 2 3/4 times the growth of GDP, we’re “only” increasing it at just over twice the growth of GDP. As Monty over on the daily DOOM threads over at Ace of Spades HQ would say, “Welcome the newest senior member of the Loyal Order of the Terminally Boned.”

December 6, 2011

The Solis “Miracle” – less than what was claimed

by @ 11:22. Filed under Economy, Politics - National.

The Right Scoop flagged me to an interview Labor Secretary Hilda Solis did on The Bill Press Show yesterday (or at least it was posted yesterday) and asked whether I could look into a few claims she made at the beginning of the interview:

  • Over the last 22 months, the economy added 3 million private-sector jobs.
  • Over the last 21 months, the average private-sector job gain was around 160 thousand.
  • Both numbers were significanly better than the George W. Bush record.

It took a bit longer than I thought because I wanted to be a lot more thorough than the Labor Secretary, but it isn’t exactly all that Solis claims.

The first bit is the closest to the truth. Using the Current Establishment Survey (the part of the jobs report that differentiates between the non-farm private-sector jobs and the government jobs), the economy did gain 2,926,000 jobs between January 2010 and November 2011. While it is a bit of a stretch (like Ford’s stretch of the 302 V-8 into “5.0L”), it’s close enough for government work.

Unfortunately, the 21-month recovery in private-sector jobs, from February 2010 to November 2011, saw an average gain of 140,333 jobs per month. I don’t call overestimating reality by over 14% close, especially when the CES covers roughly a third of all workers (or somewhere just north of 40 million).

The last item on the list requires a rather lenghty bit of explanation. I could go the very-cheap route and point out that for the entirety of the Obama administration (starting with the change from January 2009 to February 2009 as the January surveys are taken before the Presidential inauguration), the private sector lost an average of 37,120 jobs per month, while over the 8 years of the Bush administration (again starting with the January 2001-February 2001 change and ending with the December 2008-January 2009 change), the private sector lost just an average of 6,800 jobs per month despite a full recession and 2/3rds of a second. That would be way too easy, however.

I could also compare the first 21-month stretch of unbroken private-sector job growth under Bush to the current streak under Obama (average of +152,860 jobs/month to +140,333 jobs/month), but Bush’s streak began far later than Obama’s. In fact, it was exactly one year later into the recovery, August 2003, that the jobs market stopped producing CES private-sector losses.

Using the CES numbers, the private sector added 705,000 jobs between July 2002 and April 2004, for an average of +33,570 per month. The private sector added 2,947,000 jobs between February 2010 and November 2011, for the aforementioned average of +140,333 per month. However, if the 22-month time frame is narrowed down to the last 6 months, the Obama recovery (May 2011-November 2011) lags behind the Bush recovery (October 2003-April 2004), with an average of +132,830 per month compared to an average of +144,500 per month.

The bad news is the CES, while it covers an estimated 1/3rd of the labor force, double-counts those who hold multiple jobs and pretty much misses those who are either self-employed or working at a start-up. The Current Population Survey, though it is far smaller than the CES because it covers “only” 60,000 people each month, is still an order of magnitude bigger than your typical political survey, counts multiple job-holders only once and covers the portion of the survey who are self-employed.

The CPS chart that comes closest to the non-farm private payroll CES is the private wage-and-salaried non-farm workers chart. Between July 2002 and April 2004, 1,987,000 more people found private-sector wage/salaried work (an average of +94,620 per month), while between February 2010 and November 2011, 3,103,000 more people found private-sector work (an average of +147,760 per month).

However, that still doesn’t include the self-employed. While 299,000 more people were self-employed between July 2002 and April 2004, 364,000 fewer people were self-employed between February 2010 and November 2011.

Adding the two together nets 2,286,000 more people either self-employed or employed by a private entity between July 2002 and April 2004 (an average of +108,860 per month), and 2,739,000 more people either self-employed or employed by a private entity between February 2010 and November 2011 (an average of +130,430 per month). The same “last-6-month” metric shows the same lag for the Obama recovery – +111,170 self-employed/private employed per month between May 2011 and November 2011, and +132,830 self-employed/private employed per month between October 2003 and April 2004.

October 20, 2011

The $35B Hostage

In an effort not to be seen as a lame duck President, or worse yet, completely irrelevant for his last year in office, President Obama is fighting harder and harder to pass legislation, any legislation that could be viewed as populist.  One such effort at populism is his effort to pass a jobs bill.

After getting shut down by his own party on a jobs bill that was a smaller version of the original stimulus plan, Obama has decided to try to slip through individual components.  The first effort of piecemeal has been whittled to $35B and is ostensibly focused on hiring or keeping police, fire fighters and teachers employed.

Obama let Biden loose yesterday to stump for the new jobs bill.  In attempting to make a point for passage of the bill, Biden said:

“In 2008, when Flint had 265 sworn officers on their police force, there were 35 murders and 91 rapes in this city. In 2010, when Flint had only 144 police officers, the murder rate climbed to 65 and rapes, just to pick two categories, climbed to 229. In 2011, you now only have 125 shields. God only knows what the numbers’ll be this year for Flint if we don’t rectify it.”

When confronted on his remarks, Biden followed up with:

“Let’s get it straight, guy. Don’t screw around with me. Let’s get it straight,” Biden responded. “I said rape was up three times in Flint. Those are the numbers. Go look at the numbers. Murder is up, rape is up, burglary is up. That’s what I said.”

Joe, Joe, Joe….

Joe attempts to argue that the number of police officers are the single largest reason for the number of violent crimes, especially murder and rape. He makes this assertion by using statistics from a microcosm, Flint Michigan, and wants us to believe that they extend to the country as a whole.

If you would ask Joe, he would tell you that we are woefully short of police and other law enforcement personnel. Under Joe’s logic, we should be seeing unchecked increases in violent crime during the current economic times. Joe may want to check with the FBI on what their statistics show. The FBI statistics clearly show that over the past few years, violent crime has been coming down. That fact is true on both a total basis as well as based on the rates per 100,000 population. In fact, contrary to Biden’s view of near anarchy, rapes per 100,000 were down to levels not seen since the mid ’70s and murder rates not seen since the early 60s.

OK, so I think it’s safe to say that Flint has bigger issues than the number of police they have on the street. At best, they are an outlier to national statistics. But, let’s says Biden is right, let’s say we do need more police to reduce rapes. If that is true, why is the administration only putting $5B of the bill towards policemen? Does Biden believe that $5B will eliminate rape completely in the United States? If not, what will he tell the woman whose rape would have been prevented by the $1 spent beyond the $5B? Will he tell her that teachers were more important? Will he tell her that firefighters were more important? Maybe Joe will tell her that additional DMV clerks were more important than her physical safety and self esteem?

Doesn’t matter how you slice it Joe, your comments are bad logic if I am kind and asinine if I’m honest. If you really believed what you were saying, you would put every last dollar of the $35B to hire police. Even then, there would be one woman who’s officer wouldn’t be hired inside of the $35B and she would be raped as a result…at least according to Joe. I guess we can just refer to this poor woman as the $35B hostage.

October 8, 2011

Saturday Hot Read – WSJ’s “103,000 vs. 1.1 million”

by @ 8:30. Filed under Economy Held Hostage.

Tom Blumer has been noting the failure of the current “recovery” versus the recovery from the 1981-1982 recession for some time. Before I take you to the main event, I do encourage you to look at the latest from Tom; he also explains how the “103,000 jobs added in September” isn’t quite all in September.

This morning, The Wall Street Journal jumped on board this train, with a front-page story (unfortunately, behind the paywall), a banner companion must-see graphic (fortunately, not behind the paywall), and a little look at the third Septbembers of Ronald Reagan’s and Barack Obama’s terms. The devastating part:

As it happens, the biggest one-month jobs gain in American history was at exactly this juncture of the Reagan Presidency, after another deep recession. In September 1983, coming out of the 1981-82 downturn, American employers added 1.1 million workers to their payrolls, the acceleration point for a seven-year expansion that created some 17 million new jobs.

Bear in mind that is, depending on whether one measures the end of the 1981-1982 recession as October 1982 or November 1982, a mere 11 or 10 months (respectively) after the end of the recession, while we’re in the 27th month of “recovery”. The similar point in this “recovery” is either April 2010 or May 2010. April 2010 saw a seasonally-adjusted job growth of 277,000, and May 2010 saw a seasonally-adjusted job growth of 458,000.

The bigger problem is what happened after that 10th/11th month of recovery. The next month after that point in the 1980s where there was job contraction was June 1986, and after that, July 1990. Meanwhile, June 2010, July 2010, August 2010 and September 2010 all saw job contraction.

September 27, 2011

Why the POR Economy is not recovering

(H/T – Monty)

This is a few months old, but this piece from Rob Arnott relayed by John Mauldin explains why we’re headed into a double-dip recession (all emphasis in the original):

Consider a simple thought experiment. Let’s suppose the government wants to dazzle us with 5% growth next quarter (equivalent to 20% annualized growth!). If they borrow an additional 5% of GDP in new additional debt and spend it immediately, this magnificent GDP growth is achieved! We would all see it as phony growth, sabotaging our national balance sheet—right? Maybe not. We are already borrowing and spending 2% to 3% each quarter, equivalent to 10% to 12% of GDP, and yet few observers have decried this as artificial GDP growth because we’re not accustomed to looking at the underlying GDP before deficit spending!

From this perspective, real GDP seems unreal, at best. GDP that stems from new debt—mainly deficit spending—is phony: it is debt-financed consumption, not prosperity. Isn’t GDP, after excluding net new debt obligations, a more relevant measure? Deficit spending is supposed to trigger growth in the remainder of the economy, net of deficit-financed spending, which we can call our “Structural GDP.” If Structural GDP fails to grow as a consequence of our deficits, then deficit spending has failed in its sole and singular purpose.

By this measure, the economy is no better off than we were in 1998. Indeed, our soverign debt problem is even worse than it appears. From the conclusion:

Even our calculation of the national debt burden (debt/GDP) needs rethinking. Is the family that overextends correct in measuring their debt burden relative to their income plus any new debt that they have accumulated in the past year? Isn’t it more meaningful to compute debt relative to Structural GDP, net of new borrowing?! Our National Debt, poised to cross 100% of GDP this fall, is set to reach 112% of Structural GDP at that same time, even without considering off-balance-sheet debt. Will Rogers put it best: “When you find yourself in a hole, stop digging.”

August 30, 2011

Tax the rich? They’re already becoming extinct.

by @ 22:47. Filed under Economy Held Hostage, Taxes.

(H/T – Dad29)

Buried in an early-August Reuters story on the preliminary 2009 Statistics of Income tables produced by the Internal Revenue Service is this little “gem”:

The number of Americans reporting incomes of $10 million or more also plunged even more than the steep drop in income for the population as a whole.

Just 8,274 taxpayers reported income of $10 million or more in 2009, down 55 percent from 18,394 in 2007. Compared with 2007, total real income of these top earners in 2009 fell 58.6 percent to $240.1 billion, but average income slipped just 8.1 percent to $29 million.

August 20, 2011

Just (UN) Do It!

Following his most recent campaign tour through the Midwest, the Divider and Agitator in Chief is going on vacation.  Oh, but don’t call this a real vacation as the Divider and Agitator in Chief will be working hard while hanging out on Martha’s Vineyard. 

If you hadn’t noticed, the economy isn’t doing so well these days.  It’s apparent that the Divider and Agitator in Chief has noticed the poor economy.  Just before going on vacation to the Vineyard, he announced that he will make a serious policy speech addressing his ideas on what should be done to get job creation going right after his vacation he spends some time contemplating what should be done.

I’m glad the Divider and Agitator in Chief will be addressing the jobs issue.  However, I’m getting really concerned about all that gray hair he opportunistically sports.  Michelle says he has earned everyone of those gray hairs, I can only imagine it’s because he worries so much and works so hard for us.  As a heart attack and bypass survivor, I want to do my part to keep our Divider and Agitator in Chief’s stress in a safe range.  To that end, I offer the President the following advice for his “jobs creation speech” so that he can rest, relax and play golf while he’s on vacation at Martha’s Vineyard.

Are you ready?  My idea is so simple I’m surprised The Divider and Agitator in Chief hasn’t come up with it before.  Here’s what the Divider and Agitator in Chief should propose doing in his big speech:

NOTHING!

The problem this Divider and Agitator in Chief has is that like a two year old in a fine crystal store, everything he touches he breaks!  Doing or touching anything at this point, will only result in higher unemployment because that is what every effort of his has resulted in.  In fact, now that I think about it, if the Divider and Agitator in Chief really wanted to create jobs, the best thing he could do is UN DO damn near everything he has done since being in office!

OK, this is a hard concept for the Divider and Agitator in Chief.  In fact, it’s probably a hard concept for damn near every government employee and elected official.  They all think their jobs are “to do things.”  No, dammit, get your fingers off and quit coming up with a new set of uncertainty to insert in the economy!  See, I told you it was simple.

Still don’t understand?  Let me give some specifics to the Divider and Agitator in Chief:

  • UN DO the restrictions and blocking on new fossil fuel exploration – how many jobs have we lost or sent away in the Gulf of Mexico?  How many jobs could we have in ANWR or Colorado?  How many additional mining jobs could we have if we quit running scared of our own shadow over coal?  Turning loose our energy industry would not only increase jobs, it would decrease energy costs.  Wow, a twofer on the first suggestion!
  • UN DO the EPAs undercover efforts to implement cap and trade by regulating carbon dioxide off the planet!  Take a look at what’s happening in the utility industry.  Major electrical generating companies are looking at shuttering plants because they’re too expensive to upgrade for the new regulations.  Do you think any of these companies are hiring people for these plants?  Only enough to eek by.  If a plant is slated for closing, companies will get by on skeleton crews so that they don’t incur extra costs when it comes time to close the plant.  Oh, and if you don’t think businesses across the country are concerned about the threat of increasing electrical costs and potential brown outs, you’re fooling yourself!  All you need to do is look at Texas where they are already planning for brown outs as a result of the new regulations!
  • UN DO the NLRB’s rabid intensity against all jobs that are none union.  How many jobs would begin in South Carolina alone or not uncreated or shipped overseas,  if the NLRB quit trying to enforce all union all the time policies?

Oh, I could go on and on listing things that the Divider and and Agitator in Chief could UN DO but let me leave you just one last one:

Placebocare!  UN DO it!  I talk to a lot of senior business executives as a part of my work.  The number one thing discussed as we look into the next year or two and the number one thing that has them tentative about the future is understanding the impact of Placebocare on their businesses.  UN DOing this legislation alone would remove a huge overhang on the US business environment.

OK, there’s my idea.  I hope this helps the Divider and Agitator in Chief have a more restful vacation time for planning his campaign his next year.  It probably will be a part of his speech because look at the cool T-shirt I just received as a thank you:

July 27, 2011

Negotiating Against Yourself

After a several week “government shutdown” in Minnesota the recently passed budget has been celebrated as a great success for the tea party and other conservatives. Rush Limbaugh himself heralded the announcement by Governor Mark Dayton that he would accept the Repubilcan’s proposal as “Dayton caves!”

Admittedly, there is much to like of the new Minnesota budget: The total package is a bit under $36B as compared to a projected need of $39B, there are legislative changes that will give greater leverage for school districts to negotiate with teacher unions and several that will help to reduce the acceleration of growth for future budgets.

Unfortunately, there are also some things in the new Minnesota budget that are not good. To get the agreement, Republicans agreed to some one time revenue in the form of bonding a settlement from cigarette companies and most offensive, putting off payment of approximately $700M committed to schools that will force the schools to borrow until they get paid.

I’m told that the Republican leadership wanted the final budget to be $34B. Unfortunately, rather than leaving themselves room for negotiating, their original offer to Governor Dayton and the Democrats was $34B. Leadership was concerned about the MSM and Democrat meme that they were “cutting spending” when in fact they were increasing it from the previous budget. They thought that by offering $34B, they would be seen as “reasonable” and not have to fight for their principles. They were wrong.

Dayton promptly vetoed the $34B budget and demanded that any new budget must have tax increases. It was fairly obvious that Dayton was expecting and planning for a state government shutdown. Rather than hold pat, the Republicans immediately began negotiating and their negotiations were focused on adding revenue to increase the budget beyond the $34B.

Dayton rebuffed all of the Republican attempts to find a “compromise” and caused the government to shut down. After nearly three weeks, Dayton announced that he would accept the Republican’s last offer and “caved.” Unfortunately, the “cave” was at a number much higher than the Republicans wanted the budget to be and paid for in part, with “accounting tricks.”

Some would call the final budget the result of compromise, I wouldn’t be among them. Unfortunately for Minnesota taxpayers, the final budget was a result of poor negotiating by Republican leadership. Had they begun their negotiation at a number lower than what they were willing to accept or if they had caused Dayton to make major concessions before they found “new revenue”, the outcome could have been much better. In my opinion, the Republican leadership in Minnesota made critical errors and negotiated more against themselves than they did the Democrats.

Why am I outlining in a Wisconsin based blog, what happened in Minnesota, especially since I no longer live there? Because, what happened in Minnesota is exactly what is happening with John Boehner and DC Republicans.

In April, Paul Ryan set out a detailed roadmap for dealing with budget deficits including methods to deal with ever increasing entitlement costs. At the time, John Boehner endorsed the Ryan plan saying:

“In order to move forward I think Paul Ryan has set the bar in terms of the kinds of targets we need to meet and the kind of serious effort that is required given the deficit we have. I fully support Paul Ryan’s budget, including on Medicare.”

The “Ryan Plan” passed the House but was voted down in the Senate.

Roll forward to July and Boehner supported “Cut, Cap and Balance,” a bill that didn’t have a detailed budget but did provide for a combination of budget cuts and a balance budget amendment in exchange for an increase in the debt ceiling. On the day the House voted on CCB, Boehner said:

…(CCB is) the most responsible thing that we can do to address our problems today, and to address our problems long term.

Cut, cap and balance was killed by the Senate.

After CCB, Boehner tried “the grand bargain” with President Obama. Reportedly, that would have had $4T of reductions….until Obama threw a hissy fit and left.

Now Boehner is trying a paltry $1.2T of cuts which have been scored by the CBO as only $850B in cuts.

Boehner is now on record with supporting at least four and maybe as many as five or six different plans for dealing with the budget and at least indirectly, the debt limit. Rather than standing on one of these plans, Boehner has spent the last 2 weeks negotiating with anyone who will talk to him, Obama, Reid, Pelosi, Bo the dog, to find a solution for raising the debt limit. Every negotiation he enters further undercuts his credibility and resolve (if he really had any) to the only two plans (Ryan or CCB) that actually deal with our current situation in a way that doesn’t simply kick the can for some additional period of time.

The effect of Boehner’s “negotiations” have been not one iota of change from the Democrats.  If anything, Obama has become more transfixed on raising taxes and Reid yelling “no” even louder.  With all of his “negotiations,” it turns out that the only negotiating Boehner has been doing is with h

I’ve said numerous times that Boehner is no conservative. Worse, I’m not sure he is a whole lot better than Barack Obama. Boehner is unable to determine what he stands for and is even less willing to stand for it once he determines what it is that he does stand for. Boehner has been in Washington too long and is too committed to being a participant in the dance that is Washington politics rather than fighting for the principles that he purports to hold.

Washington operates under the false assumption that doing something, anything is always better than doing nothing. Boehner’s proposal for a debt limit increase is worse than doing nothing. John Boehner is about to but the period at the end of the sentence that will head our country into history as a banana republic.

June 30, 2011

No Shit Sherlock!

In remarks today to CNBC, Federal Reserve Governor, Alan Greenspan said that the quantitative easing (stimulus) undertaken by the current Fed Chairman hasn’t done squat!

“There is no evidence that huge inflow of money into the system basically worked,” Greenspan said in a live interview.

This current criticism is not to be confused with Greenspan’s admission last September, that the Porkulus bill had no where near (if at all) the effect that was promised (remember that unemployment was never going over 8% if we did porkulus and now can’t seem to get under 9%!)  No, today’s revelation is focused on Brenanke’s attempt to revive the economy by printing billions and billions (hello Rod Serling) of additional greenbacks and shoving them into the economy.

Since late 2008, the Fed has pushed nearly $2B of additional paper money into the economy.This during a time when the economy was somewhere between marking time and shrinking.  the Fed’s basic theory was that by putting those dollars into the economy, various asset prices would increase and this would cause businesses and consumers to feel more “wealthy” which would let them feel like they could spend more, thus moving economic growth along.

Brenanke was right about increasing asset prices.  Since QE1 and 2, the stock markets have all increased and commodity prices have all increased, some of them dramatically.  However, none of this has seemed to convince businesses or consumers that it’s now OK to spend like the federal government.  Why?  What did Brenanke miss?

I told you here that Obama’s election chances would hinge on the 3Gs; Gas, Groceries and GDP.  Equally, Brenanke’s ability to get people to believe they had more wealth and therefore to spend it, also was driven by the 3Gs.  Through the entire time of QE1 and QE2, gas and groceries (made up from commodities that Brenanke wanted to increase the price of) increased in price.  At the same time, net home values (the place where much of the “wealth” from about 2004 to 2008 came from) continued to decline.  Add to all of this the fact that unemployment has increased or stayed relatively flat during the money influx and what do you know…..consumers have acted rationally and decided to save and pay down debt rather than buy new stuff with the bucks that Uncle Ben has been air dropping into the economy.

The real question is what will happen to the economy now that the stimulus has ceased?  One theory would suggest that if the economy doesn’t pick up, commodities have been artificially run up and have the potential to be the next asset bubble to pop.  If the economy does pick up, the additional dollars available could take an inflation rate that has been recently increasing to an accelerated level and bring us back to the days of Jimmy Carter.

Obama and his administration acolytes continue to operate with the belief that if they say it is so, it is.  While “repeatedly says” that he focused on jobs and the economy and that things are improving, anyone outside of the Washington belt way can easily see that none of that is true.  When Alan Greenspan says that the stimulus had no effect, as if it is some kind of an oracle insight, the rest of America says “No shit Sherlock!”

Initial jobless claims stuck above 425K, new “U” word introduced by CNBC

by @ 9:02. Filed under Economy Held Hostage.

Initial jobless claims on a seasonally-adjusted basis declined by 1,000 last week from 429,000 to 428,000. While Reuters rewrote their story to avoid the use of its favorite “u” word (or specifically, its cousin “less than expected”) and thus caused me to blow up the original post, CNBC retained their dip into the dictionary to create its own dire headline with a new “u” word after switching from an Associated Press report to the Reuters report currently linked.

The use of “unexpectedly” and its cousins by the media, and mostly Reuters, has become so prevalent that Ed Morrissey has made it a more-or-less regular feature at Hot Air. CNBC’s use of “ugly”, however, is new.

Since that was originally attached to the AP’s report that looked at the longer-term trend, I’ll give the lowlights from that report:

– After a brief trip to 375,000 in February, which was in the middle of a 7-of-9 week trend of claims below 400,000, initial jobless claims spiked to 478,000 in April and in the AP’s words, “…have shown only modest improvement since that time,” as they have been above 400,000 the last 12 weeks.

– The four-week rolling average has been in the neighborhood of 426,000 initial claims per week for the last month.

– While the total number of people on the 26-week unemployment insurance “fell” to 3.7 million in the middle of June, the total number of people on unemployment, including those on extended benefits, remains at nearly 7.5 million.

There is a reason why I put “fell” in the last bullet point in scare quotes – that measure has been significantly gamed in the last week. Tom Blumer at BizzyBlog first noticed the constant upward revision of the prior week’s initial jobless claims. While this marks the first week in 15 that upward revision has not happened (indeed, it was not revised at all), there was a significant upward revision in the total number of people on 26-week unemployment insurance. Last week, the “advance” numbers of people on unemployment insurance for the week ending 6/11 was 3,697,000. This week, the final number settled at 3,714,000. That makes the claim that the 6/19 advance number of 3,702,000 represents a decrease rather suspect.

A copy of this is at The Right Scoop

June 23, 2011

Thursday Hot Read – Patrick Ishmael’s “Fatal Attraction: Politicians and ‘Eco-Devo’”

by @ 19:18. Filed under Economy, Politics.

Over at The Weekly Standard, Patrick Ishmael highlights a boondoggle of a pork-barrel “green” project that purports to turn St. Louis’ Lambert International Airport into an “Aerotropolis”. The plan is to provide subsidies for $300 million worth of warehouses and another $60 million to international freight companies. There’s one bit of a problem, however:

Never mind that there are already more than 18 million square feet of unused warehouse space around the airport. And never mind that it was only a dozen years ago that the city of Saint Louis splurged in building a third runway — at a cost of more than a billion dollars — that is virtually unused today. That was another eco-devo project that failed to deliver promised jobs and economic activity. It also led to the condemnation and destruction of more than 2,000 homes under eminent domain.

Michael Webber, a consultant with long experience in the international shipping industry, debunks almost all of the claims made for the Aerotropolis, saying that Saint Louis “has adequate on-airport capacity (existing facilities or unimproved land) to host adequate air cargo facilities to support the unlikely maximum of 8 projected weekly freighters,” the number expected to be facilitated by the legislation.

The big problem is air freight is prohibitively expensive, which is why typically only very-time-sensitive items are shipped by air. The idea floated by one of the Missouri advocates that cattle could be flown to China is patently absurd.

Apparently Milwaukee is another place where the Aerotroplis concept is forming. There isn’t quite as much empty warehouse space around Mitchell Field as there is around Lambert, but there’s also two different rail lines bounding the airport, which makes for a more-balanced shipping component.

June 17, 2011

Friday Hot Read – IBD’s “The Economy Dems Now Own”

The gang over at Investor’s Business Daily really teed off on DNC Chair Debbie Wasserman Schultz’s admission that the economy was now the Democrats’. I’ll give you the first four (no pun intended) paragraphs to whet your appetite; as always, I highly encourage you to read the rest:

The head of the Democratic National Committee says the administration has turned the economy around. So let us give discredit where discredit is due.

Joe Biden should sue DNC chief and Florida Congresswoman Debbie Wasserman Schultz for copyright infringement based on her statement at a Politico breakfast. We thought the vice president had a monopoly on statements completely detached from reality.

“We own the economy,” Schultz said. “We own the beginning of the turnaround, and we want to make sure that we continue that pace of recovery, not go back to the policies of the past under the Bush administration that put us in the ditch in the first place.”

That’s right, Debbie, you guys own the economy, though you might explain President Obama’s chuckle about those shovel-ready jobs not being as shovel-ready as he thought. Does your “pace of recovery” include an official rate of unemployment of 9.1% after a failed trillion-dollar stimulus was supposed to cap it at 8% and force it downward?

June 9, 2011

Initial unemployment claims continue to disappoint

by @ 8:08. Filed under Economy Held Hostage.

Reviewing the initial unemployment claims, this time at 427,000 for last week, is becoming something of a checklist:

  • Higher than expectedCheck (Bloomberg’s economists predicted 419,000, Reuters’ economists predicted 415,000)
  • Unexpectedly higher than expectedCheck (both Reuters and Bloomberg put it in the headline and the lede)
  • Prior week’s number revised upwardCheck (Tom Blumer notes the prior week’s increase from 422,000 to 426,000 is the 14th week in a row this has happened)

Can you say, “Double-Dip DEMpression”?

June 6, 2011

Moody’s latest to reassess Treasury security risk

Less than 2 months after Standard and Poor’s cut its federal government credit outlook to negative, Moody’s announced on Thursday that it expects to place its federal government credit rating under review as there still is no agreement on whether to live within the government’s revenue limits or to raise the debt ceiling. To wit, this is the set of implications from Moody’s:

1) The likelihood that Moody’s will place the US government’s rating on review for downgrade due to the risk of a short-lived default has increased. Since the risk of continuing stalemate has grown, if progress in negotiations is not evident by the middle of July, such a rating action is likely. The Secretary of the Treasury has indicated that the government will have to drastically reduce expenditure sometime around August 2 if the debt limit is not raised; the initiation of a rating review would precede this date.

2) If a debt-ceiling-related default were to occur, Moody’s would likely downgrade the rating shortly thereafter. The extent of and length of time before a downgrade would depend on how factors surrounding the default affect the government’s fundamental creditworthiness, including (a) the speed at which the default were cured, (b) an assessment of the effect of the default on long-term Treasury borrowing costs, and (c) measures put in place to prevent a recurrence. However, a rating in the Aa range would be the most likely outcome. Any loss to bondholders would likely be minimal or non-existent, as Moody’s anticipates that a default would be cured quickly.

3) If default is avoided, the Aaa rating would likely be affirmed after any review. Whether the outlook on the rating would be stable or negative would depend upon whether the outcome of the negotiations included meaningful progress toward substantial and credible long-term deficit reduction. Such reduction would imply stabilization within a few years and ultimately a decline in the government’s debt ratios, including the ratio of debt to GDP.

Allow me to translate the last item. If the only thing that is done is a short-term solution, either a “clean” debt-ceiling increase or a massive spending cut that doesn’t affect interest (or a combination thereof), Moody’s is going to join S&P in having a negative outlook on debt.

I’ll borrow a couple of the slides my Congressman, Paul Ryan, included in his series of April listening sessions to illustrate why a short-term solution, regardless of what it is, won’t work. The first shows the trajectory of publicly-held debt from 1940 to 2080 (click for the full-size graphic):

Do note how soon the publicly-held debt crosses the 100% of GDP threshhold (sometime between 2020 and 2030). I could also point out where it ends up, but one thing Ryan pointed out in the listening sessions is that the CBO cannot project what the economy does after 2037 because the computers crash when trying to model that.

The second one focuses on the projected yearly spending on just the “Big Three” of the entitlement programs, Social Security, Medicare, and Medicaid, versus projected federal revenues, again as a percentage of GDP (click for the full-sized graphic):

I really wish Ryan had included interest on the debt in the chart because it would better illustrate just how much entitlements and debt crush the life out of the rest of the federal budget. Indeed, in a floor speech on Thursday, Ryan pointed out that by the end of this decade, 20% of the total tax revenue would be dedicated to interest. That brings the entitlement plus interest share of the tax revenue to somewhere around 85%.

The unsustainable trend is undeniable. Once revenues stabilize at the historic 18% (give or take a couple tenths of a point) of GDP, just the entitlements will rapidly approach 100% of the revenues, hitting somewhere around 90% by the aforementioned 2037 GDP model crash date, and crossing 100% around 2050.

The bond ratings agencies are making it crystal clear that simply saying the government can borrow more isn’t going to cut it. Similarly, as much as many people don’t want to hear it, thinking we can avoid default just by cutting spending isn’t going to cut it. Indeed, given the current tax collection rate (due to the collapsed economy, not to the Bush tax cuts; though that’s an argument for another post), Congress could zero out all discretionary spending, and we’d still run a deficit and thus increase the debt.

Revisions/extensions (6:15 pm 6/6/2011) – James Pethokoukis, who just returned from China, says the Chinese want a long-term fix.

Another item in James’ piece is that some of the “smart money” seems to think the Treasury will prioritize debt service and Social Security checks. Without specific instructions from Congress, I wouldn’t put my money on that.

May 16, 2011

Porkulus destroyed/forestalled a net 599,000 jobs

by @ 12:10. Filed under Economy Held Hostage.

(H/T – Greg Mankiw via PowerLine and Speaker John Boehner)

Ohio State released a report on the effects of Porkulus by a pair of economists, Timothy Conley and Bill Dupor, on job creation and destruction. They estimated that, through September 2010, while roughly 450,000 state and local government jobs were “saved/created” by Porkulus, roughly 1,000,000 private-sector jobs were “destroyed/forestalled” by it:

Our benchmark results suggest that the ARRA created/saved approximately 450 thousand state and local government jobs and destroyed/forestalled roughly one million private sector jobs. State and local government jobs were saved because ARRA funds were largely used to offset state revenue shortfalls and Medicaid increases rather than boost private sector employment. The majority of destroyed/forestalled jobs were in growth industries including health, education, professional and business services. This suggests the possibility that, in absence of the ARRA, many government workers (on average relatively well-educated) would have found private-sector employment had their jobs not been saved.

They divided the jobs market into 4 broad categories: state/local government, “HELP” services (private health and education, leisure and hospitality and business and professional service), goods-producing employment and “non-HELP” services (the last includes federal employees). They also found that the majority of Porkulus aid given to states and local governments was “fungible”, defined as replacing other state/local revenues.

Under the “fungibility-imposed” scenario, state and local governments increased their payrolls by 443,000 relative to what would have been expected without Porkulus, and those entities in the “non-HELP” services raised their payrolls by 92,000 (unfortunately, there is no split between the federal government employment versus private-sector employment in this category), while the entities in the goods-producing sector decreased their payrolls by 362,000 and those in the “HELP” services sector decreased their payrolls by 772,000.

If “fungibility” is not imposed, those numbers get worse. Under that scenario, only state and local governments increased their payrolls, by 473,000. Meanwhile, “Non-HELP” services payrolls dropped by 443,000, goods-producing payrolls dropped by 832,000, and “HELP” services payrolls dropped by 882,000.

This actually surprised the economists. Quoting from the conclusions portion:

Much work on the effects of the ARRA remains to be done. We found, surprisingly, either negligible or negative effects of the Act on total employment; thus, it is important to explore whether alternative empirical specifcations, besides the historical ‘Keynesian multiplier’ approach of Section 5 used by other researchers, are capable of finding a signicant positive jobs effect.

My money is against that.

May 6, 2011

Mostly-positive monthly jobs news – +244K jobs, +268K private-sector

by @ 8:05. Filed under Economy.

The “unexpected” jobs numbers releases continued today, this time in a mostly-positive direction. The seasonally-adjusted 244,000 jobs gained in April was the largest since last May, and the equally-seasonally-adjusted 268,000 private-sector jobs gained was the highest since February 2006. That, along with a drop in the long-term unemployed, should overshadow an increase in the unemployment rate to 9.0%.

Further, Tom Blumer noted that, along with upward-adjustments in the numbers reported for February and March, we finally have more non-temporary private-sector jobs than we did at the official end of the recession in June 2009.

However, not all is roses and rainbows; this only reflects numbers recorded through mid-month. The question is whether the positivity in the first half of the month will overcome the negativity in the latter part.

May 5, 2011

Initial unemployment claims spiked to 474,000 last week

by @ 8:40. Filed under Economy Held Hostage.

Did you want the bad news, the “unexpected” news, or the butt-ugly news? Too bad; you’re getting all three, in four chunks.

The bad news is seasonally-adjusted initial unemployment claims spiked to 474,000 last week, its highest since mid-August 2010, with the rolling 4-week average climbing to 431,250, its highest since November 2010.

The “unexpected” news is Reuters, which once again broke out its favorite adjective to describe the POR Economy™, estimated that it would drop from the prior week’s initial reporting of 429,000 to 410,000.

The butt-ugly news, part 1 (from Tom Blumer), is that for the 8th consecutive week, the prior week’s numbers were revised upward. This time, it was from the aforementioned 429,000 to 431,000. I’ll sttate right now that the trend will, indeed, continue next week.

The butt-ugly news, part 2 (also from Tom), is that for the first time in at least a year, the non-seasonally adjusted initial jobless claim number is higher than that of the same week the prior year. Can you say, “Double-dip DEMpression”? I knew you could.

Revisions/extensions (7:53 pm 5/5/2011) – A comment from Tom on his blog reminded me of something a friend-of-a-friend used to do when he drove school buses, namely apply for unemployment during Easter vacation. I decided to go back through the historical record to see if the floating holiday is or isn’t reflected in the seasonal adjusting. It turns out that, over the previous 11 years (2000-2010) there is a rather consistent 2-week (usually; some years saw this effect only happen 1 week) period anchored by Easter saw an average 20,000-claim spike (each week) in initial jobless claims compared to surrounding weeks. Given that Easter is exceptionally late this year, the week-ending-4/23 jump to a now-adjusted 431,000 claims should have mostly been anticipated, though I would argue that it shouldn’t have been much more than 425,000 claims.

However, that does not explain the further jump in this report. The key is going to be the next two weeks. If initial jobless claims continue to be above the 425,000 line (and I fear they’ll be well above that), we’re back on the downward slide of the economy (as if we aren’t due to inflated gas prices and deflated dollar).

[No Runny Eggs is proudly powered by WordPress.]